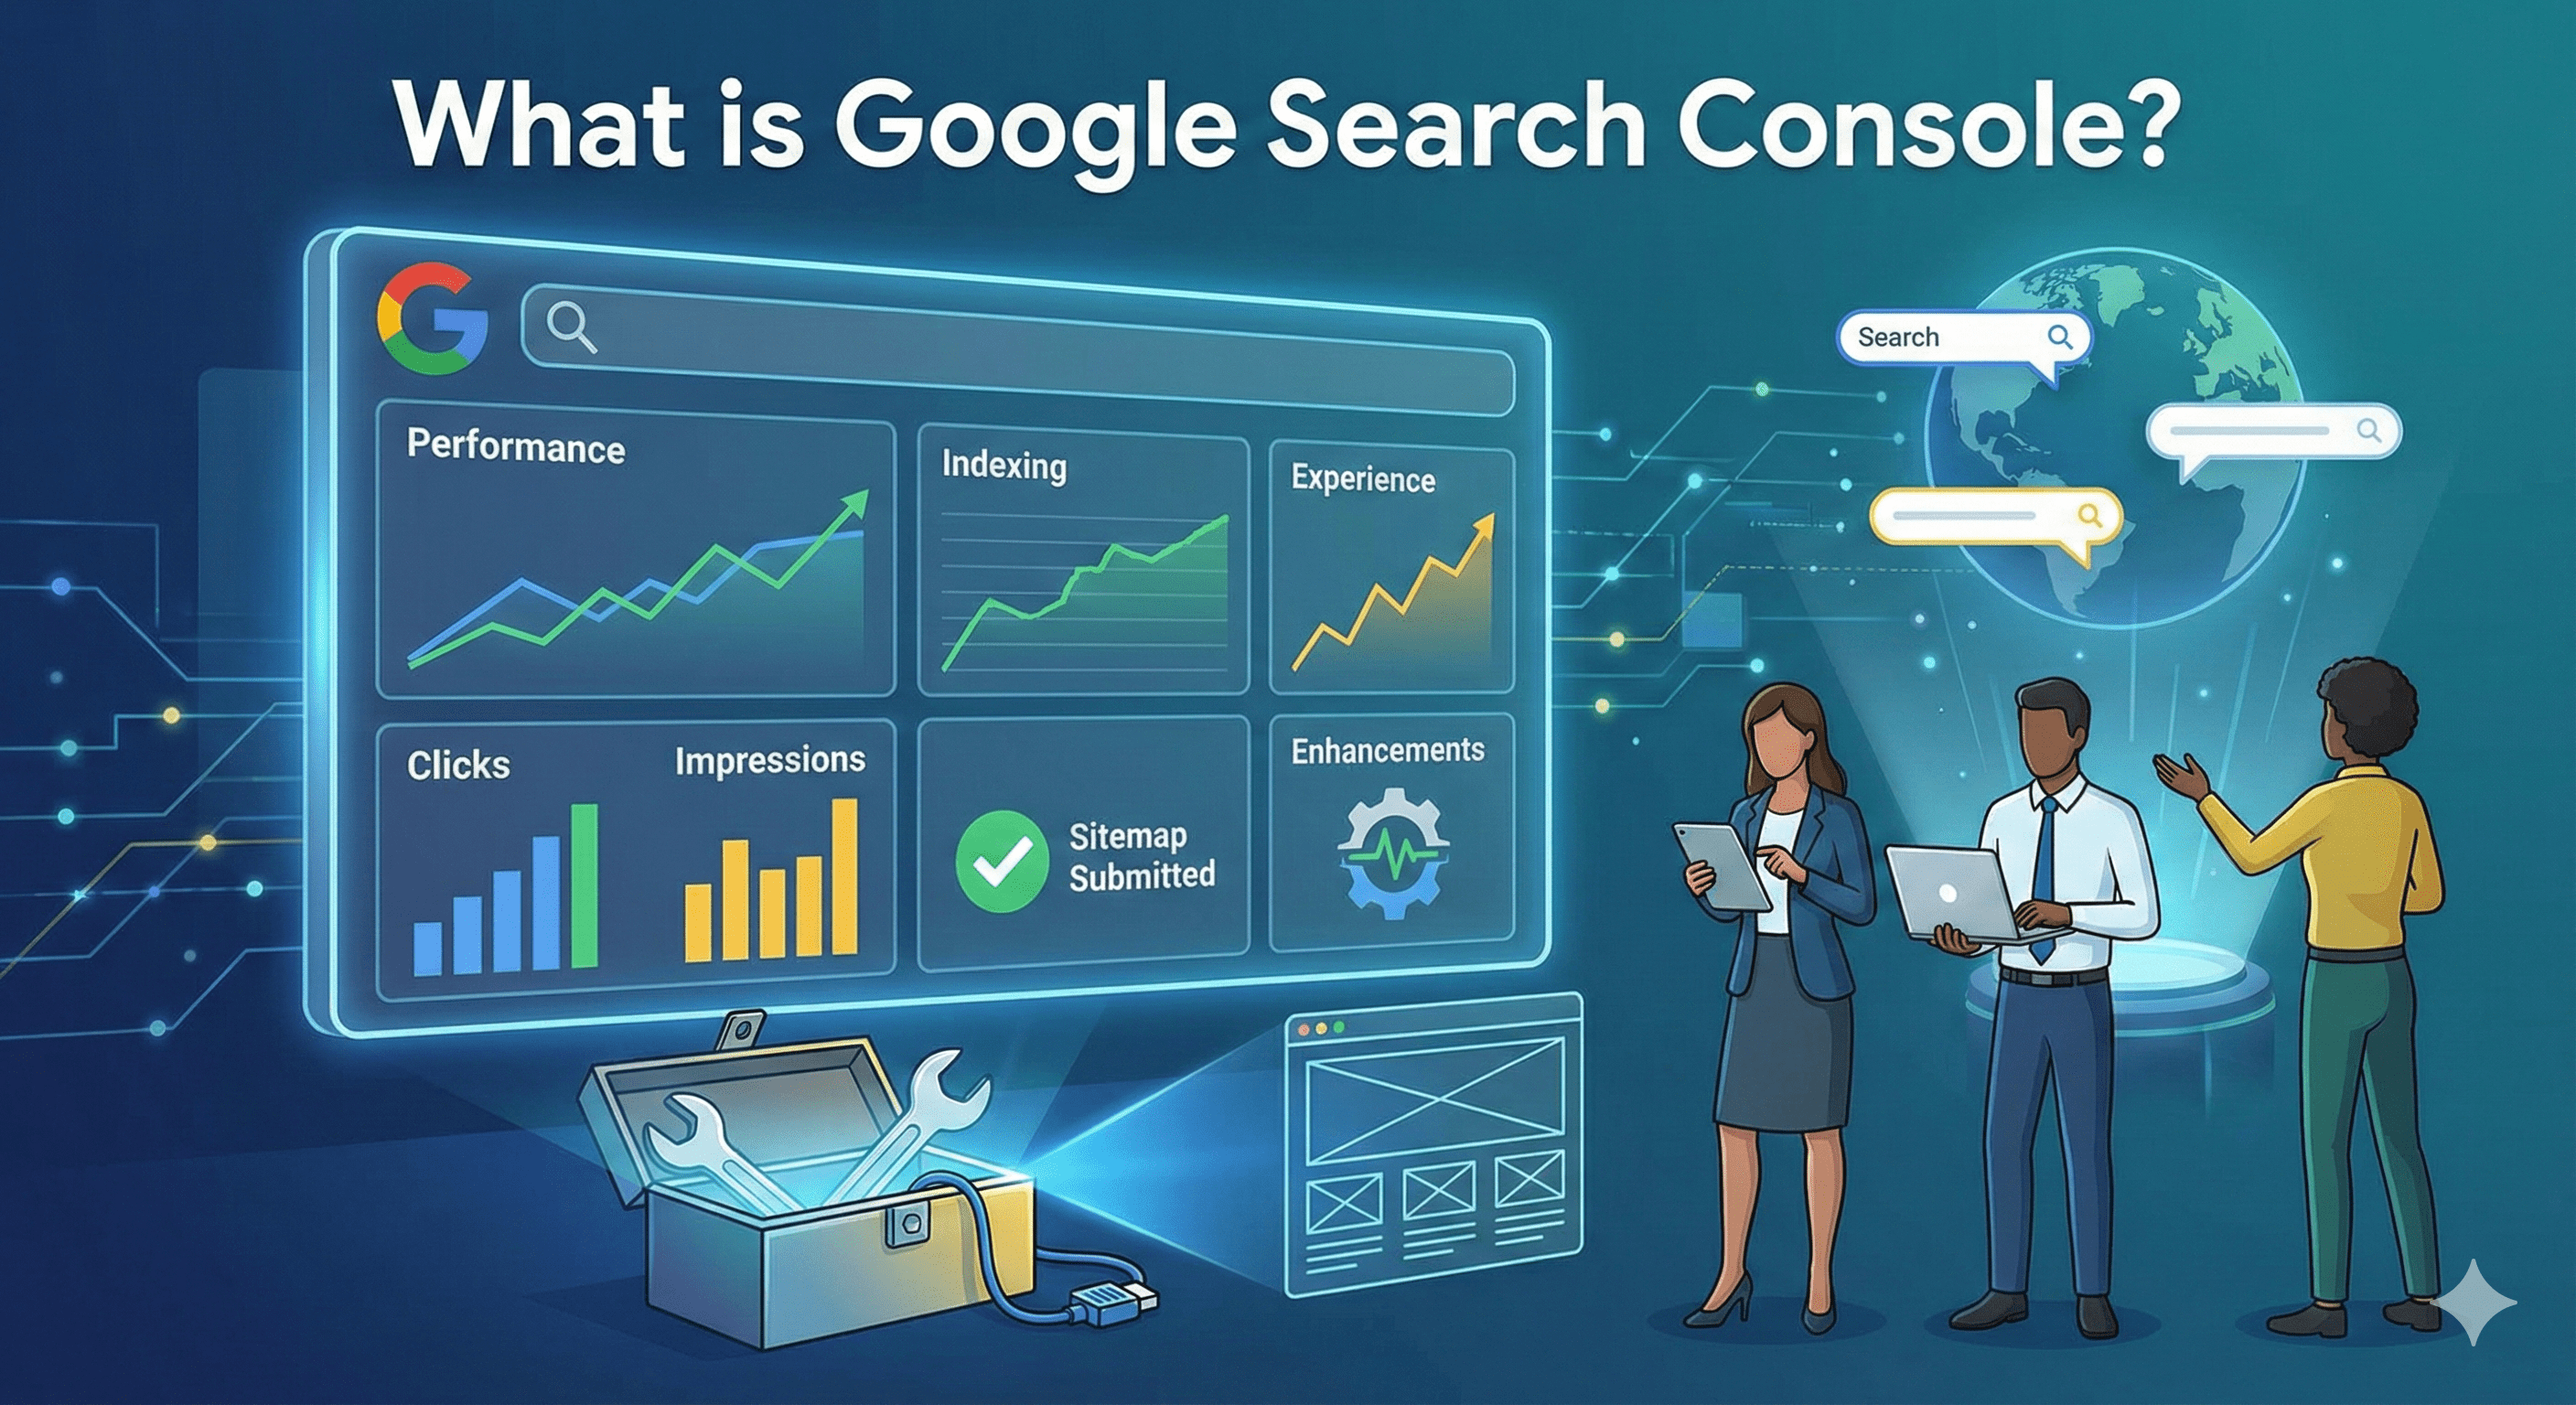
GSC Page Experience & Core Web Vitals Explained
Google Search Console's Page Experience and Core Web Vitals reports help you understand how real users experience your site in terms of speed, stability, and usability. While great content is still essential, Google increasingly expects pages to also deliver a smooth, fast, and mobile-friendly experience.
This article explains how these reports work, how to interpret the data, and how to use them to improve both user experience and SEO performance.
Why Page Experience Signals Matter for SEO
Page experience signals focus on how users interact with your site, not just what the page contains. Google uses these signals to help differentiate between pages with similar relevance.
Key benefits of good page experience:
- Faster loading pages reduce bounce rates
- Better usability improves engagement and conversions
- Strong Core Web Vitals support long-term SEO stability
- Mobile-friendly experiences align with mobile-first indexing
While page experience is not a standalone ranking system, poor performance can hold otherwise strong content back.
Page Experience–Related Reports in Google Search Console
Google Search Console provides several reports that together form a complete view of page experience.
Core Web Vitals Report
Measures real-world performance using Chrome user data (CrUX). This is the most critical experience report in GSC.
Metrics include:
- LCP (Largest Contentful Paint) – loading performance
- INP (Interaction to Next Paint) – responsiveness
- CLS (Cumulative Layout Shift) – visual stability
Reports are segmented by:
- Mobile vs Desktop
- Good, Needs Improvement, Poor URLs
Page Experience Report
This report combines multiple signals into a single overview, including:
- Core Web Vitals status
- Mobile usability
- HTTPS usage
- No intrusive interstitials (when applicable)
It answers a simple question: Do users have a good overall experience on my pages?
Mobile Usability Report
Focuses on common mobile UX issues, such as:
- Content wider than screen
- Clickable elements too close together
- Text too small to read
- Viewport configuration errors
Since Google uses mobile-first indexing, these issues can directly affect crawling, indexing, and rankings.
Enhancements Reports
Depending on your site, you may also see enhancement reports for:
- Breadcrumbs
- Product markup
- FAQs
- Videos
- Other structured data types
While not strictly "page experience," errors here can impact how pages appear and perform in search.
How to Interpret Core Web Vitals Data
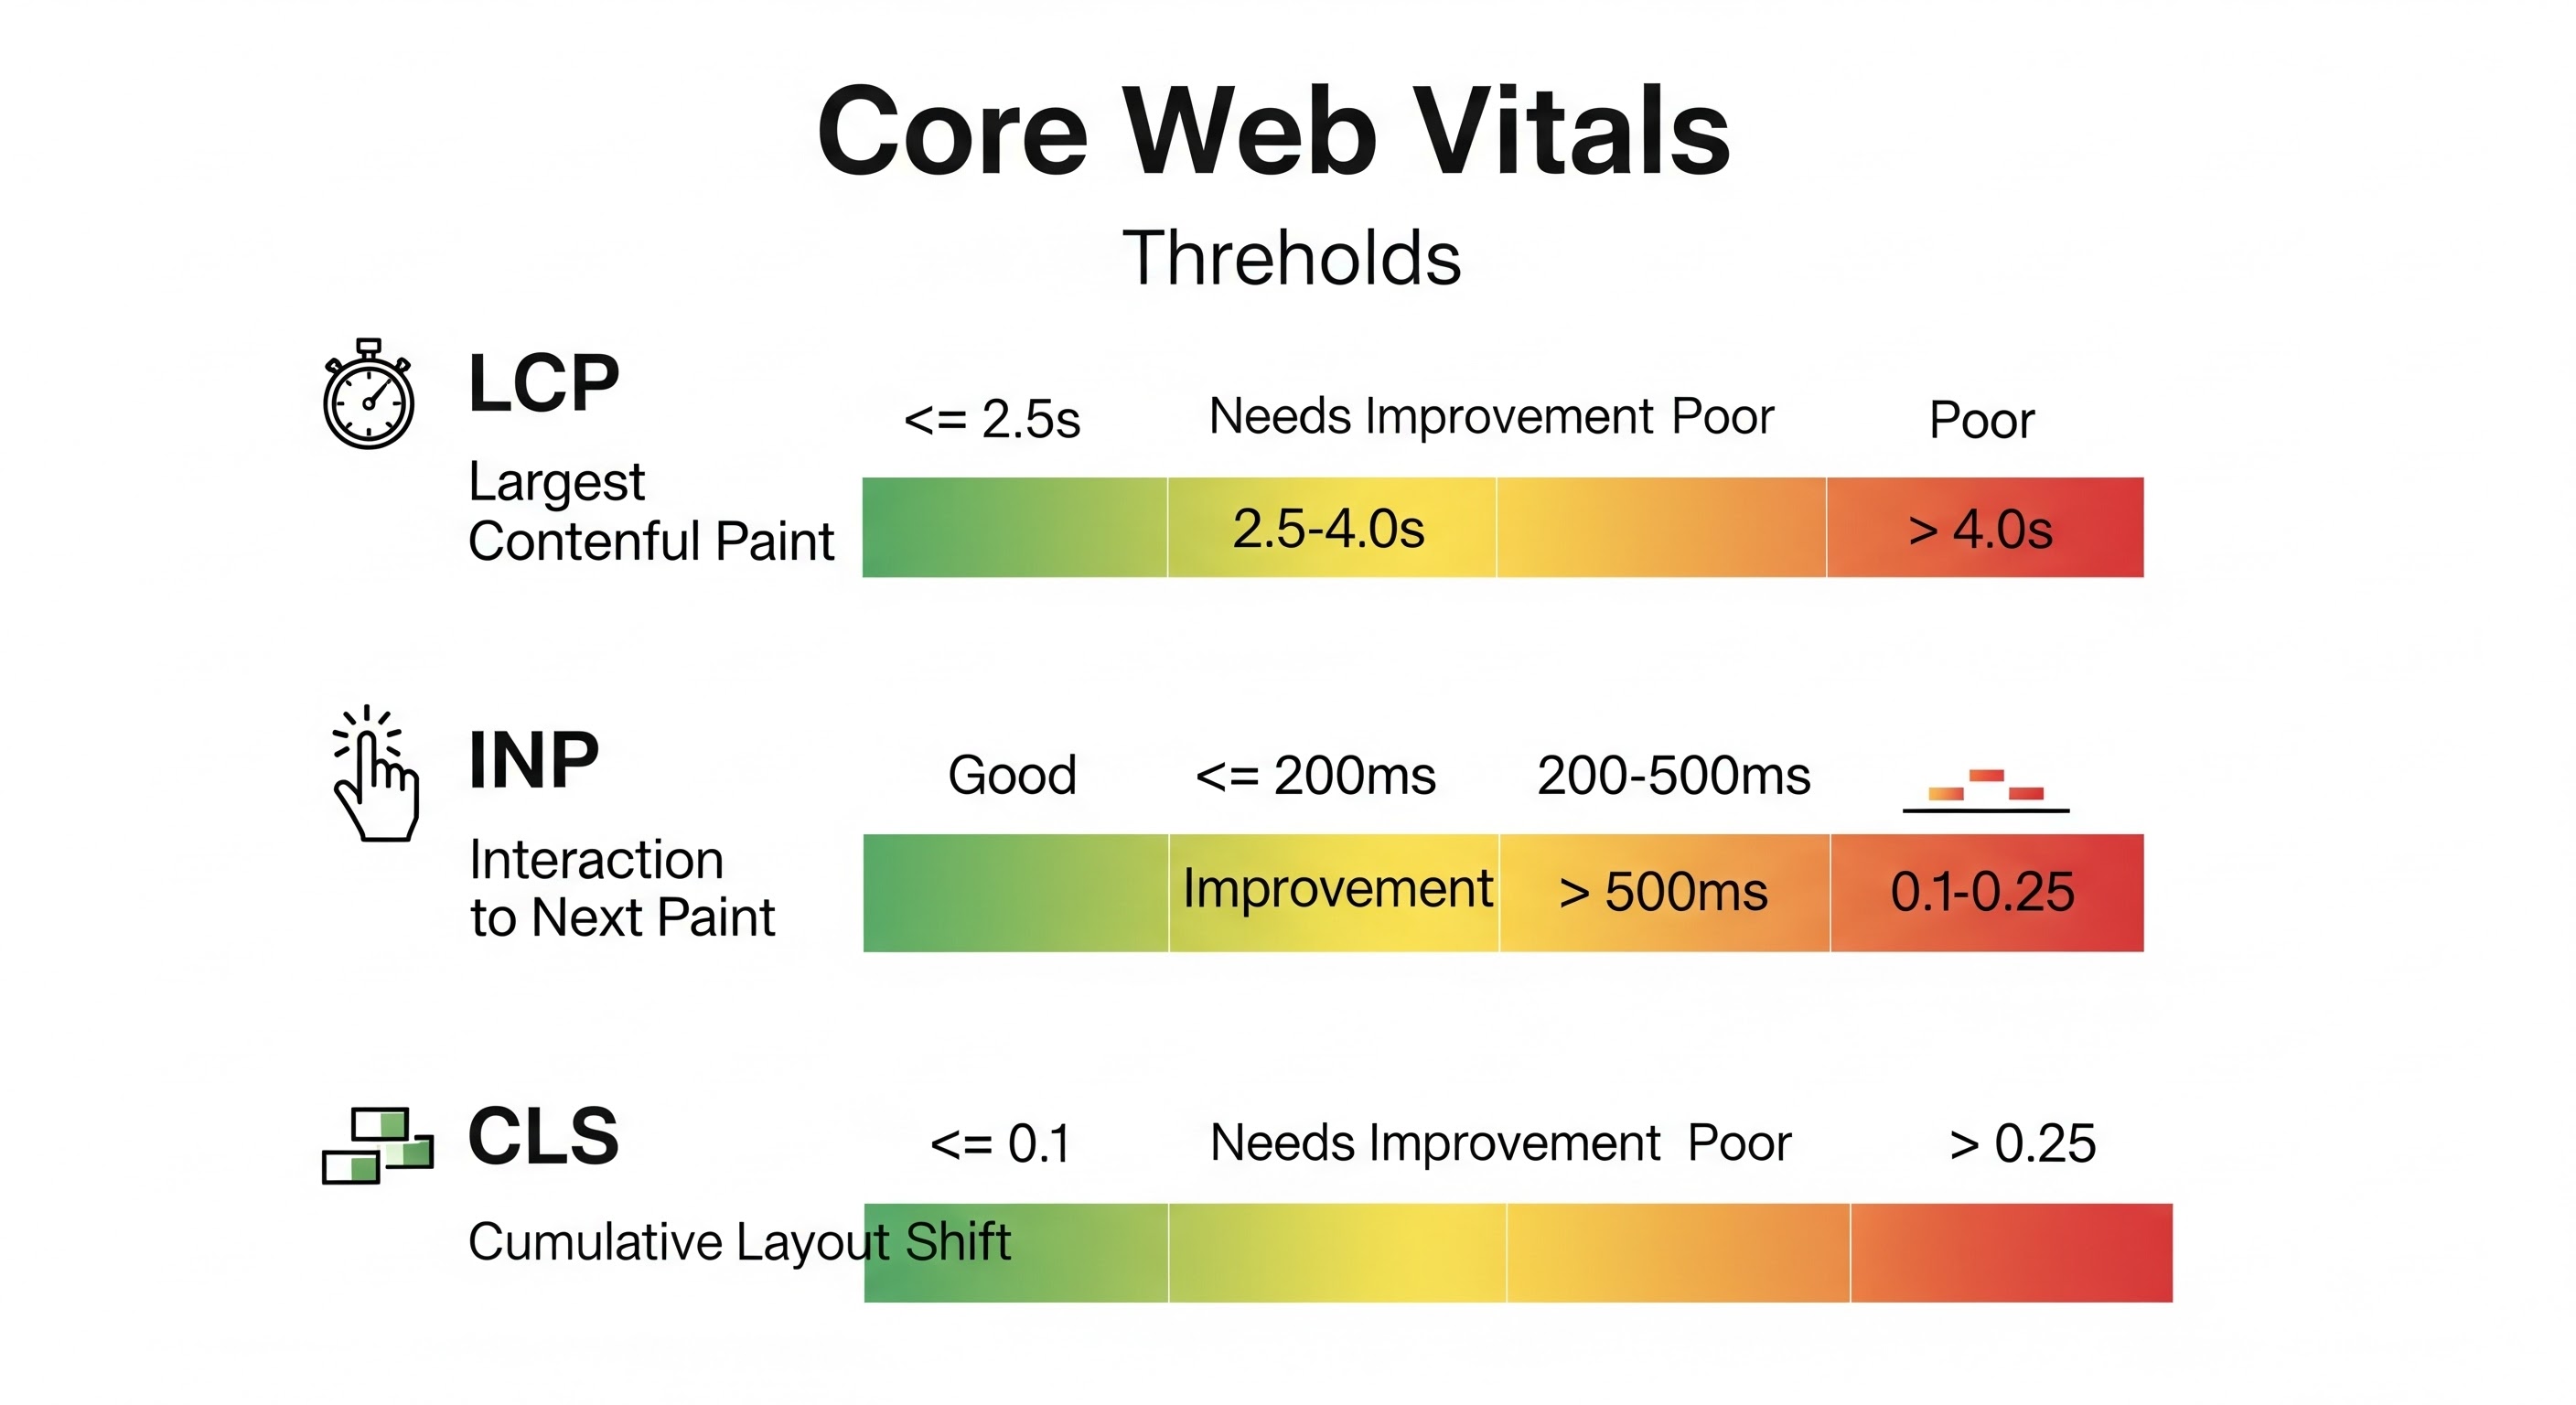
Core Web Vitals Thresholds (2026)
Largest Contentful Paint (LCP)
Largest Contentful Paint (LCP) is a Core Web Vital that specifically focuses on loading speed. It measures the time it takes for the largest image block or text block to become visible within the viewport.
A poor LCP experience often indicates that the server response time is slow or that a large, unoptimized resource (like a hero image or video) is delaying the page's primary content from appearing. Improving LCP directly addresses the user's initial perception of your site's performance.
text-align:center| Rating | Time Threshold |
|---|---|
| Good | ≤ 2.5 seconds |
| Needs Improvement | 2.5–4.0 seconds |
| Poor | > 4.0 seconds |
How to Improve LCP
To get your LCP under that 2.5-second "Good" threshold, you need to optimize the path between the user clicking a link and the main content rendering.
- Optimize Critical Assets: Ensure that the element identified as the LCP (usually a hero image) is loaded as a priority. Use to tell the browser to fetch that image immediately.
- Reduce Server Response Times (TTFB): Use a Content Delivery Network (CDN) to serve content closer to your users and optimize your server-side code or database queries.
- Compress and Format Images: Large, unoptimized images are the most common LCP culprits. Use modern formats like WebP or AVIF and ensure images are properly sized for the user's screen.
- Eliminate Render-Blocking Resources: Minify and defer non-essential JavaScript and CSS so the browser can focus on painting the primary content first.
- Implement Effective Caching: Use service workers or robust browser caching so returning visitors don't have to download the same large assets twice.
Interaction to Next Paint (INP)
INP measures responsiveness—how quickly your page reacts to user input. It observes the latency of all clicks, taps, and keyboard interactions that occur during a user's entire session on a page. The final INP score is the longest (or nearly longest) interaction time recorded. High INP scores are typically caused by excessive JavaScript running on the main thread, which "blocks" the browser from responding to the user's actions, creating a sluggish or broken feel.
| Rating | Time Threshold |
|---|---|
| Good | ≤ 200 milliseconds |
| Needs Improvement | 200–500 milliseconds |
| Poor | > 500 milliseconds |
INP Optimization Tips
Improving INP is all about reducing the "input latency" and the time the browser spends processing tasks before it can show the user a visual update.
- Break Up Long Tasks: If a JavaScript function takes longer than 50ms, it’s a "long task" that blocks the main thread. Break these into smaller sub-tasks using
setTimeout()orrequestIdleCallback()so the browser can sneak in a UI update between them. - Minimize Main Thread Work: Audit your third-party scripts (like analytics or ads). These often run heavy processes that hijack the main thread, making the page feel "frozen" when a user tries to click a button.
- Optimize Event Handlers: Ensure that the logic triggered by a click or keypress is as lean as possible. Avoid doing heavy calculations or complex DOM manipulations directly inside the event listener.
- Use
isInputPending(): This API allows your JavaScript to check if there is a pending user interaction, allowing the script to yield back to the browser to handle the input before continuing its work. - Avoid Overusing Frameworks for Simple Tasks: Excessive "re-rendering" in frameworks like React or Vue can cause significant lag. Use memoization and optimize component updates to ensure the UI stays snappy.
- Prioritize Visual Feedback: Even if a background process takes time, provide immediate visual feedback (like a loading spinner or a button "depressed" state) to acknowledge the user's action instantly.
Cumulative Layout Shift (CLS)
This metric measures visual stability. It quantifies the unexpected movement of content on the page during its loading lifecycle. CLS is critical because sudden shifts—like a button moving just as a user is about to tap it—can cause frustration or lead to accidental clicks. The most common causes are images or ads that load without proper space reserved for them, or dynamically injected elements like sign-up forms and banners.
| Rating | Time Threshold |
|---|---|
| Good | ≤ 0.1 |
| Needs Improvement | 0.1–0.25 |
| Poor | > 0.25 |
CLS Optimization Tips
The goal of improving CLS is to ensure that elements on your page stay exactly where they are supposed to be as new content loads.
- Include Size Attributes for Images and Video: Always specify
widthandheightattributes in your HTML. This allows the browser to reserve the correct amount of space while the asset is still downloading, preventing a sudden layout “jump” when it appears. - Reserve Space for Ad Slots and Embeds: Third-party widgets and ads are notorious for shifting content. Wrap these elements in a
<div>with a predefined minimum height so they don’t push surrounding content down when they load. - Avoid Inserting Content Above Existing Content: Never dynamically inject banners, newsletter sign-ups, or cookie notices at the top of the page after the initial load—unless it’s a direct response to a user interaction.
- Use
font-display: swapCarefully: When a custom web font loads late, text can change size or weight, shifting nearby elements. Usefont-display: swapand choose fallback fonts with similar dimensions to reduce layout shifts. - Stick to Transform Animations: When animating elements, use CSS
transformproperties (such astranslateorscale) instead oftop,left, orheight. Transforms don’t trigger layout recalculations and keep the layout stable.
Google evaluates these metrics using real user data, not lab tests.
Mobile vs Desktop Differences
It is common to see:
- Mobile URLs failing while desktop URLs pass
- Slower LCP on mobile due to network constraints
- Higher CLS on mobile from ads or dynamic content
Always prioritize fixing mobile issues first, as they usually affect the majority of users.
Common Page Experience Problems and Solutions
1. Slow Loading Pages (Poor LCP)
Causes
- Large hero images: Unoptimized, high-resolution images or videos that are the largest element in the viewport can take a long time to download, directly delaying the LCP event.
- Slow server response times: If the server takes a long time to respond (Time to First Byte - TTFB), the entire loading process is delayed, which pushes back the start of all content rendering, including the LCP element.
- Render-blocking CSS or JavaScript: When the browser encounters non-critical CSS or JavaScript files in the head of the document, it must pause rendering the page to download and process those files. If these are large or inefficient, they "block" the main thread from painting the LCP element.
Solutions
- Compress and properly size images: Ensure that images are optimized for the web and served at the correct dimensions for the user's viewport to reduce file size and download time.
- Use modern formats (WebP / AVIF): Modern image formats like WebP and AVIF offer superior compression and quality compared to older formats like JPEG and PNG, resulting in smaller files that load faster.
- Improve server performance and caching: Reducing the server's response time through efficient hosting, optimized database queries, and aggressive caching of static assets minimizes the initial delay before content starts to load.
- Preload critical resources: Use the
<link rel="preload">attribute to tell the browser to prioritize the download of essential resources, especially the resource that will be the LCP element (e.g., the hero image), ensuring it's available as early as possible.
2. Layout Shifts (High CLS)
Causes
- Images or ads without defined dimensions: When the browser loads the page, it does not know how much space to reserve for an image or ad if the width and height attributes are missing. Once the image or ad asset finally downloads, it pushes all the content below it down, causing a significant layout shift.
- Late-loading fonts: This often results in a "Flash of Unstyled Text" (FOUT) or "Flash of Invisible Text" (FOIT). When the browser first renders text, it may use a fallback font. Once the custom web font loads, the text size, spacing, or boldness changes, and the entire block of text shifts, affecting the layout around it.
- Dynamic elements injected above content: Elements that are inserted into the page after the initial rendering—such as a sign-up form, a consent banner, or a notification that appears suddenly—can push the existing page content down, resulting in an unexpected and jarring shift.
Solutions
- Always define width and height for images and ads: By setting these attributes (or using CSS aspect ratio boxes), you tell the browser exactly how much space to reserve for the element before it loads, preventing content from jumping once the asset appears.
- Reserve space for dynamic elements: If you know a banner, ad, or form will load, use placeholder elements or CSS to ensure the space it will occupy is already accounted for in the layout, eliminating the "shift" when it loads.
- Use font-display strategies to prevent text shifts: Font-loading descriptors like
font-display: optionalorfont-display: swapcan be used to manage how and when the browser displays text while waiting for custom fonts to load, helping to reduce the visual impact of font changes.
3. Poor Responsiveness (INP Issues)
Causes of Poor Responsiveness (INP Issues)
High INP scores are typically caused by the browser's main thread being tied up and unable to respond to user actions:
- Heavy JavaScript execution: Running large amounts of JavaScript at one time, especially during page load or in response to an interaction, can block the main thread and delay the processing of user input.
- Long main-thread tasks: The main thread is responsible for everything from parsing HTML to executing JavaScript and handling user events. When a single task, often a chunk of JavaScript, takes 50 milliseconds or more to execute, it is considered a "Long Task" that prevents the main thread from doing other work, including reacting to the user.
- Inefficient event handlers: JavaScript code that runs when a user clicks or types (event handlers) might be poorly optimized, causing it to take too long to complete its work and resulting in a noticeable delay before the visual update (next paint) occurs.
Solutions for Poor Responsiveness (INP Issues)
- Reduce JavaScript bundle size: Serving less JavaScript code means the browser has less to download, parse, and execute, which frees up the main thread.
- Break up long tasks: By dividing large, time-consuming functions into smaller, asynchronous chunks, you allow the main thread to process user input events in between the execution of those chunks.
- Defer non-critical scripts: Scripts that are not essential for the initial visual display or core functionality should be loaded later (deferred) using attributes like (
deferorasync)to prevent them from blocking the main thread during the initial load. - Optimize third-party scripts: Scripts from external providers (like ads, analytics, or social widgets) are a common cause of performance issues. You should audit and optimize how these are loaded to ensure they do not create long tasks or otherwise delay responsiveness.
4. Mobile Usability Errors
Causes
- Fixed-width layouts: These are the opposite of modern responsive design, which means the layout does not adapt to different screen sizes. This is a primary cause of content being wider than the screen or requiring users to scroll horizontally.
- Small fonts or buttons: This leads to text being too small to read and clickable elements too close together, making it difficult for users to interact with the page, especially on a touch screen.
- Overlapping elements: This contributes to a poor user experience by obscuring content or making elements impossible to click, often falling under the Mobile Usability Report's focus on common mobile UX issues.
Solutions
- Use responsive design principles
- Increase tap target sizes
- Test layouts on real devices
Integrating GSC with Performance Tools
Google Search Console shows what is wrong, but not always why. For deeper diagnosis, combine it with:
- PageSpeed Insights for page-level recommendations and actionable fixes. This tool provides a unified view, running both lab data (a controlled simulation) and field data (CrUX) for a single URL. Crucially, it offers specific, actionable recommendations on what to fix. These recommendations are categorized and scored, such as "Eliminate render-blocking resources" or "Defer offscreen images," helping you prioritize technical changes.
- Lighthouse for lab-based performance audits. Built directly into Chrome DevTools, Lighthouse performs a comprehensive, lab-based audit on demand. Unlike PSI's singular focus on Core Web Vitals, Lighthouse also grades your site on Accessibility, Best Practices, and SEO. Developers typically run Lighthouse during the development phase to catch performance regressions before they are deployed to a live site.
- Chrome DevTools for JavaScript and rendering analysis. For the deepest, real-time analysis, the Performance tab in Chrome DevTools is essential. It allows developers to record a page load or user interaction and see a detailed timeline of main-thread activity, network requests, and rendering processes. This is where you can pinpoint the exact moment and cause of a Long Task that leads to a poor INP score, or precisely which resource is blocking LCP.
- Manual UX testing for real-world validation
Use GSC to identify problem URL groups, then analyze representative URLs with these tools.
Best Practices for Continuous Monitoring
- Check Core Web Vitals reports regularly, not just after issues appear
- Monitor both mobile and desktop reports
- Validate fixes using the "Validate Fix" feature in GSC
- Track trends rather than single-day fluctuations
- Align performance improvements with major releases or redesigns
Page experience is not a one-time fix. Content updates, ads, scripts, and design changes can all impact performance over time.
Final Thoughts
The Page Experience and Core Web Vitals reports in Google Search Console provide critical insight into how users actually experience your site. By understanding these metrics, prioritizing mobile performance, and combining GSC data with performance tools, you can create pages that are not only optimized for search engines, but genuinely better for users.
Strong SEO today means pairing great content with a fast, stable, and usable experience.
Frequently Asked Questions (FAQ)
- LCP (Largest Contentful Paint): Measures loading performance.
- INP (Interaction to Next Paint): Measures responsiveness.
- CLS (Cumulative Layout Shift): Measures visual stability.
- 2.5–4.0 seconds: Needs Improvement
- Above 4.0 seconds: Poor