How to Use Google Search Console Performance Report (Complete Guide)
The Google Search Console Performance Report is often the very first place SEOs look when they want to understand how a website is actually performing in Google Search. Unlike third-party SEO tools that rely on estimates, this report shows real data directly from Google — clicks, impressions, CTR, and rankings for your pages and queries.
If you know how to read and analyze this report correctly, it can tell you:
- Why traffic is dropping or increasing
- Which pages are close to ranking higher
- Which keywords deserve optimization first
- Where CTR is leaking
- How users interact across devices and countries
In this guide, you’ll learn how to fully use the Google Search Console Performance Report, understand every metric, apply filters to uncover insights, and turn data into actionable SEO improvements.
What Is the Google Search Console Performance Report?
The Performance Report in Google Search Console shows how your website appears and performs in Google Search results. It answers key SEO questions like:
- What queries are triggering my pages?
- How many people are seeing and clicking my listings?
- Where do my pages rank on average?
- How performance changes by device, country, and time?
You can find it by navigating to:
Google Search Console → Performance → Search results
This report is the foundation for search visibility analysis, content optimization, and keyword prioritization.
Overview of Key GSC Performance Metrics
Before analyzing anything, it’s crucial to understand what each metric actually means.
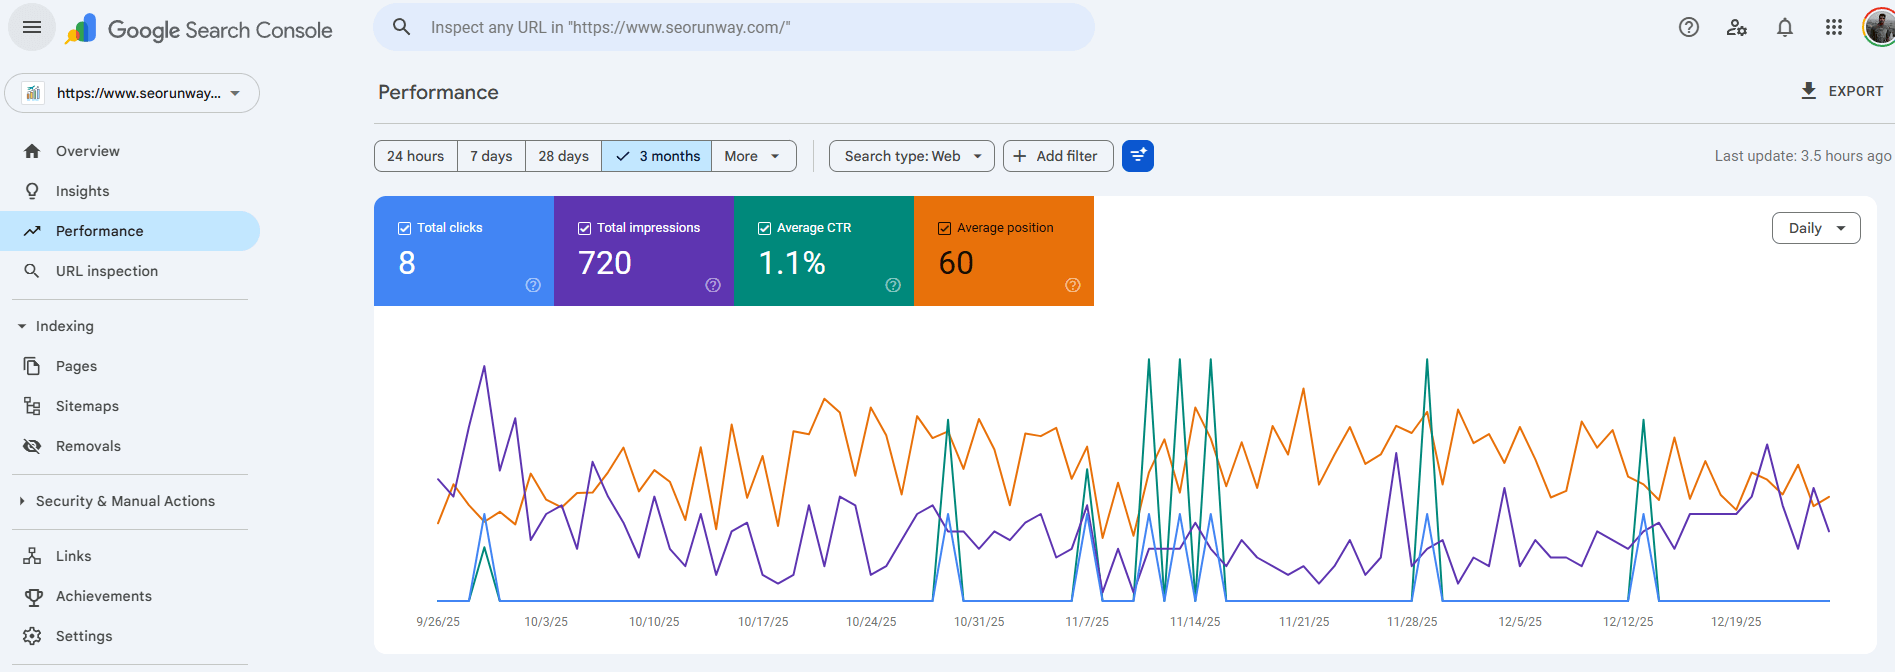
Clicks
Clicks show how many times users clicked your website from Google Search results.
- Measures actual traffic from organic search
- Affected by ranking, CTR, title/meta quality, and intent match
- More clicks does not always mean better SEO if impressions are low
Impressions
Impressions indicate how many times your site appeared in search results.
- A page can get impressions even if it ranks low
- High impressions with low clicks indicate optimization opportunities
- Useful for identifying visibility trends
Click-Through Rate (CTR)
CTR is calculated as Clicks ÷ Impressions.
- Shows how attractive your result is in search
- Influenced by titles, meta descriptions, URLs, and rich results
- Low CTR on high-ranking pages is a warning sign
Average Position
Average position represents the mean ranking of your page across all impressions.
- A page ranking at #3 and #12 may average around #7
- Not exact, but useful for tracking trends
- Best analyzed with impressions and clicks together
Queries
Queries are the actual search terms users typed that triggered your pages.
- Includes branded and non-branded keywords
- Helps uncover keyword opportunities
- Reveals search intent mismatches
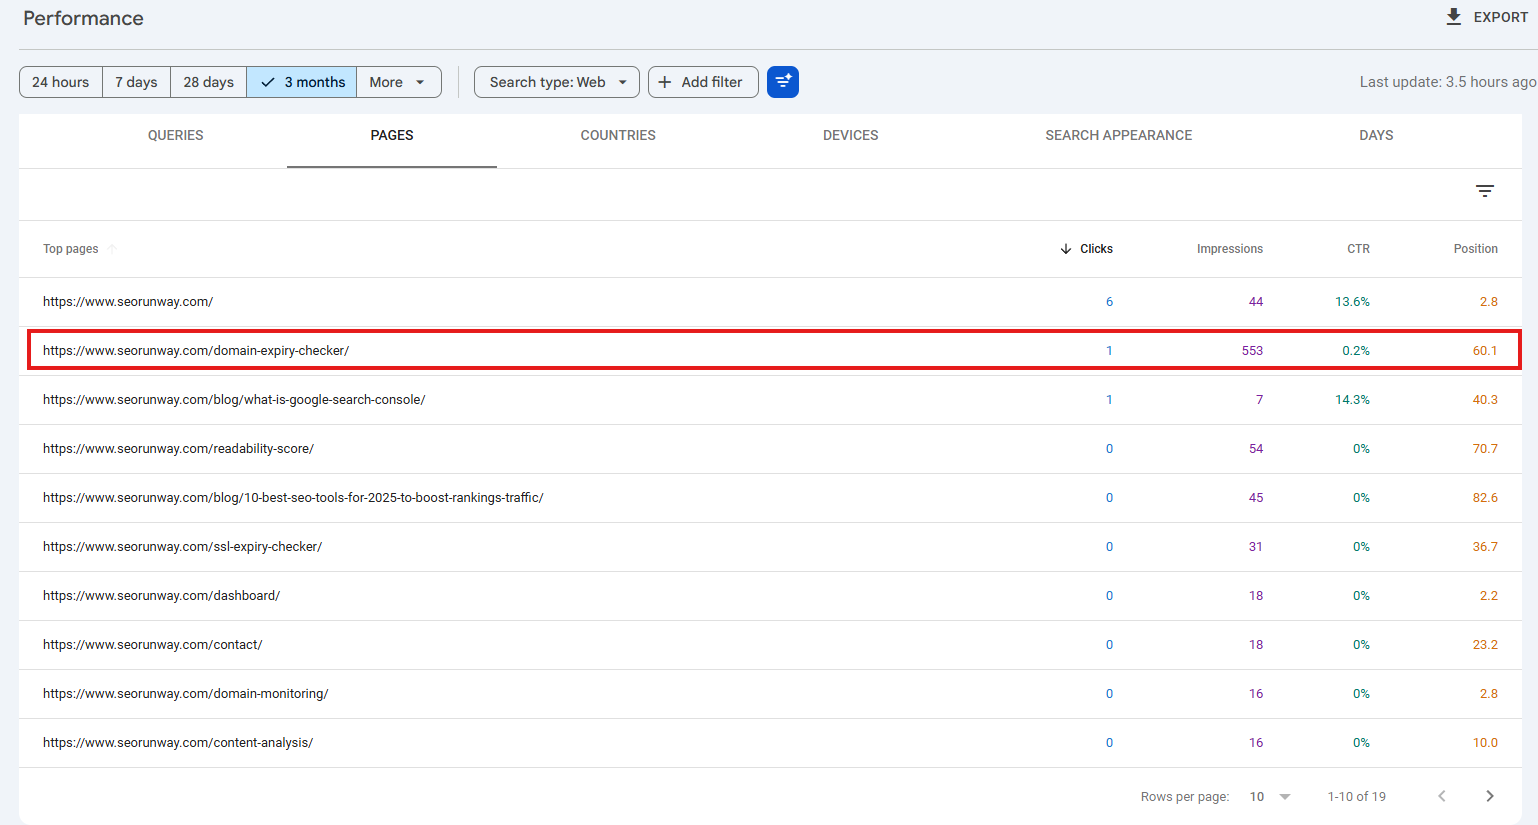
Pages
The Pages tab shows performance data at the URL level.
- Ideal for content audits
- Helps identify strong vs weak pages
- Critical for content update decisions
Countries
This report shows which countries generate impressions and clicks.
- Useful for international SEO
- Helps detect geo-specific performance issues
- Important for localization and hreflang strategies
Devices
Performance data is broken down into Desktop, Mobile, and Tablet.
- Mobile performance is critical under mobile-first indexing
- Large device gaps indicate UX or speed issues
Dates and Search Type
You can analyze performance by time range and search type:
- Web
- Image
- Video
- News
How to Interpret GSC Performance Metrics
High Impressions + Low CTR
This usually means your pages are visible but not compelling enough.
- Weak title tags
- Poor meta descriptions
- Intent mismatch
Action: Rewrite titles, improve meta descriptions, and align with search intent.
High CTR + Low Impressions
This indicates strong relevance but low visibility.
Action: Improve internal linking, content depth, and topical authority.
Improving Position but Declining Clicks
This often happens due to SERP features or increased competition.
Action: Optimize for featured snippets, FAQs, and rich results.
Using Filters to Find SEO Insights
Filters transform raw data into actionable insights.
Filter by Page
- Analyze individual URLs
- Check keyword cannibalization
- Measure content update impact
Filter by Query
- Identify ranking keywords
- Separate branded vs non-branded searches
- Understand intent alignment
Filter by Date, Device, and Search Appearance
These filters help detect trends, device-specific issues, and structured data performance.
Branded vs Non-Branded Queries in GSC
Branded Queries
Include brand names, domain terms, or product names.
- High CTR
- Strong rankings
- High intent
Non-Branded Queries
These queries drive true organic growth.
Action: Track non-branded query performance to measure real SEO progress.
Identifying Striking Distance Keywords
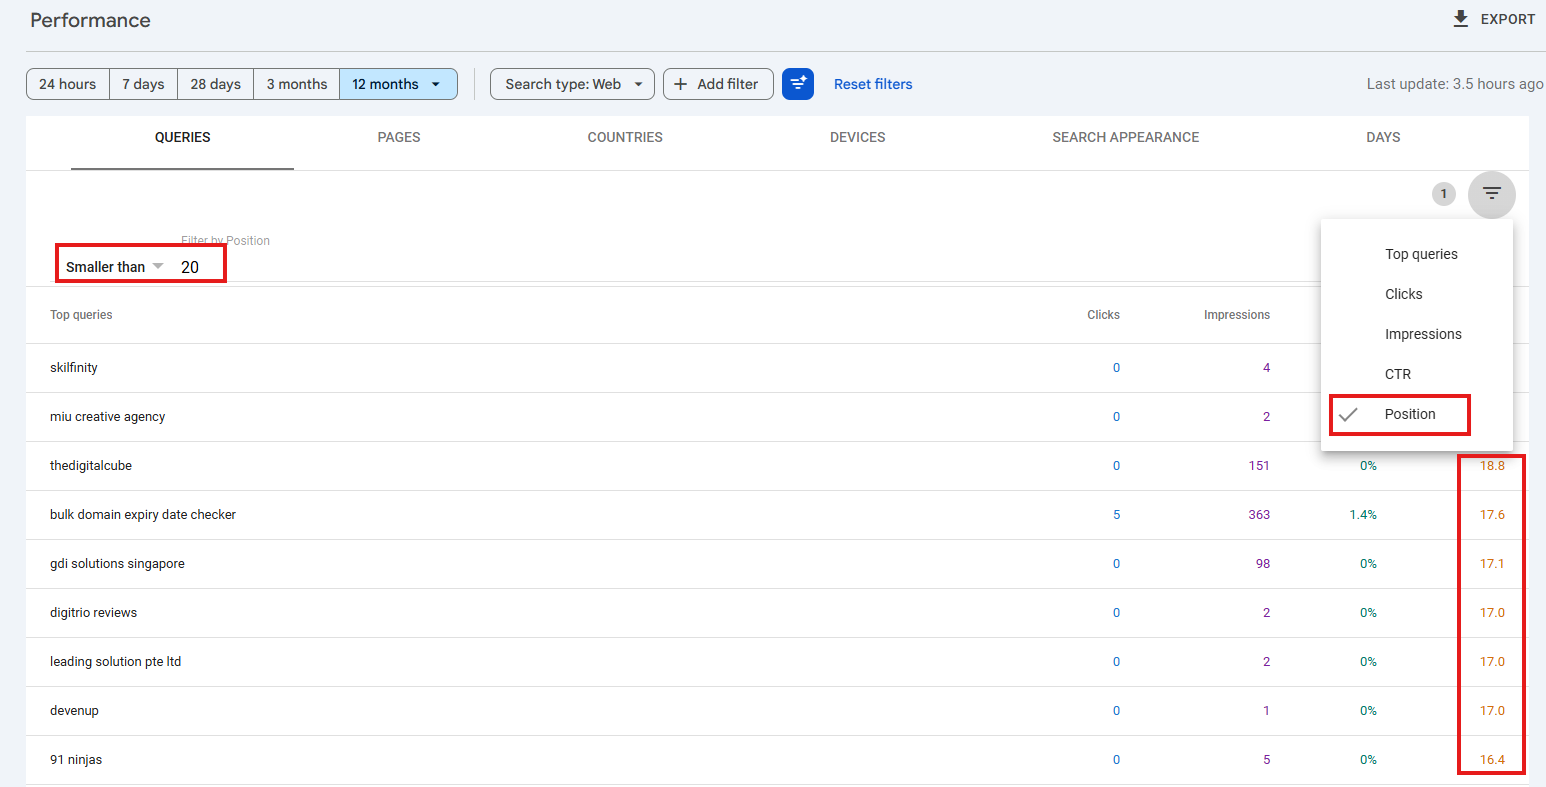
Striking distance keywords typically rank between positions 8–20 with strong impressions.
- Go to Performance → Search results
- Filter position greater than 7 and less than 20
- Sort by impressions
These keywords require minimal optimization to reach top positions.
Using Performance Data to Improve Content
Optimizing Underperforming Pages
- Update titles and meta descriptions
- Refresh outdated content
- Add FAQs and internal links
Content Update vs Redirect Decisions
GSC helps you decide whether to update, merge, or redirect low-performing pages instead of guessing.
Exporting GSC Data for Deeper Analysis
You can export Performance Report data to:
- Google Sheets
- Excel
- BigQuery
Exports allow long-term tracking, dashboards, and deeper analysis.
Example Real-World GSC Workflow
- Review performance trends
- Identify low-CTR, high-impression pages
- Find striking distance keywords
- Optimize content and internal links
- Monitor improvements after 14–28 days
- Export and track data monthly
Final Thoughts
The Google Search Console Performance Report is one of the most powerful SEO tools available. When used correctly, it shows exactly where Google already trusts your site — and where small improvements can unlock major traffic gains.
Instead of guessing, let real Google data guide every SEO decision.