Core Web Vitals in Google Search Console (Updated Guide)
Website performance is no longer just a user experience concern — it's a measurable, ranking-related signal inside Google Search Console (GSC). With Google retiring the Mobile Usability Report and consolidating performance signals under Core Web Vitals and Page Experience, SEOs and developers now rely heavily on the Core Web Vitals report in Google Search Console to evaluate real-world site speed, stability, and responsiveness.
This guide explains how Core Web Vitals work in GSC, how to diagnose performance problems, and how to fix LCP, CLS, and INP issues using practical optimization tactics.
Why Google Retired the Mobile Usability Report
Google officially retired the Mobile Usability Report because most mobile-friendliness checks are now handled automatically through responsive design standards and page experience signals.
Instead of focusing only on usability errors like "text too small" or "clickable elements too close," Google shifted toward real-world performance metrics collected from Chrome users.
These metrics are:
- Harder to fake – Based on actual user interactions rather than simulated tests
- Based on real user behavior – Reflects actual visitor experiences across devices and networks
- More strongly tied to engagement and satisfaction – Directly correlates with business outcomes
Core Web Vitals became the primary way Google evaluates whether a page delivers a good user experience across both mobile and desktop.
Core Web Vitals and Page Experience Signals
Core Web Vitals are part of Google's broader Page Experience system, which also includes:
- HTTPS security
- Safe browsing
- Intrusive interstitials
- Mobile friendliness (baseline)
While Core Web Vitals alone won't guarantee rankings, poor performance can limit organic growth, especially in competitive SERPs where content quality is similar.
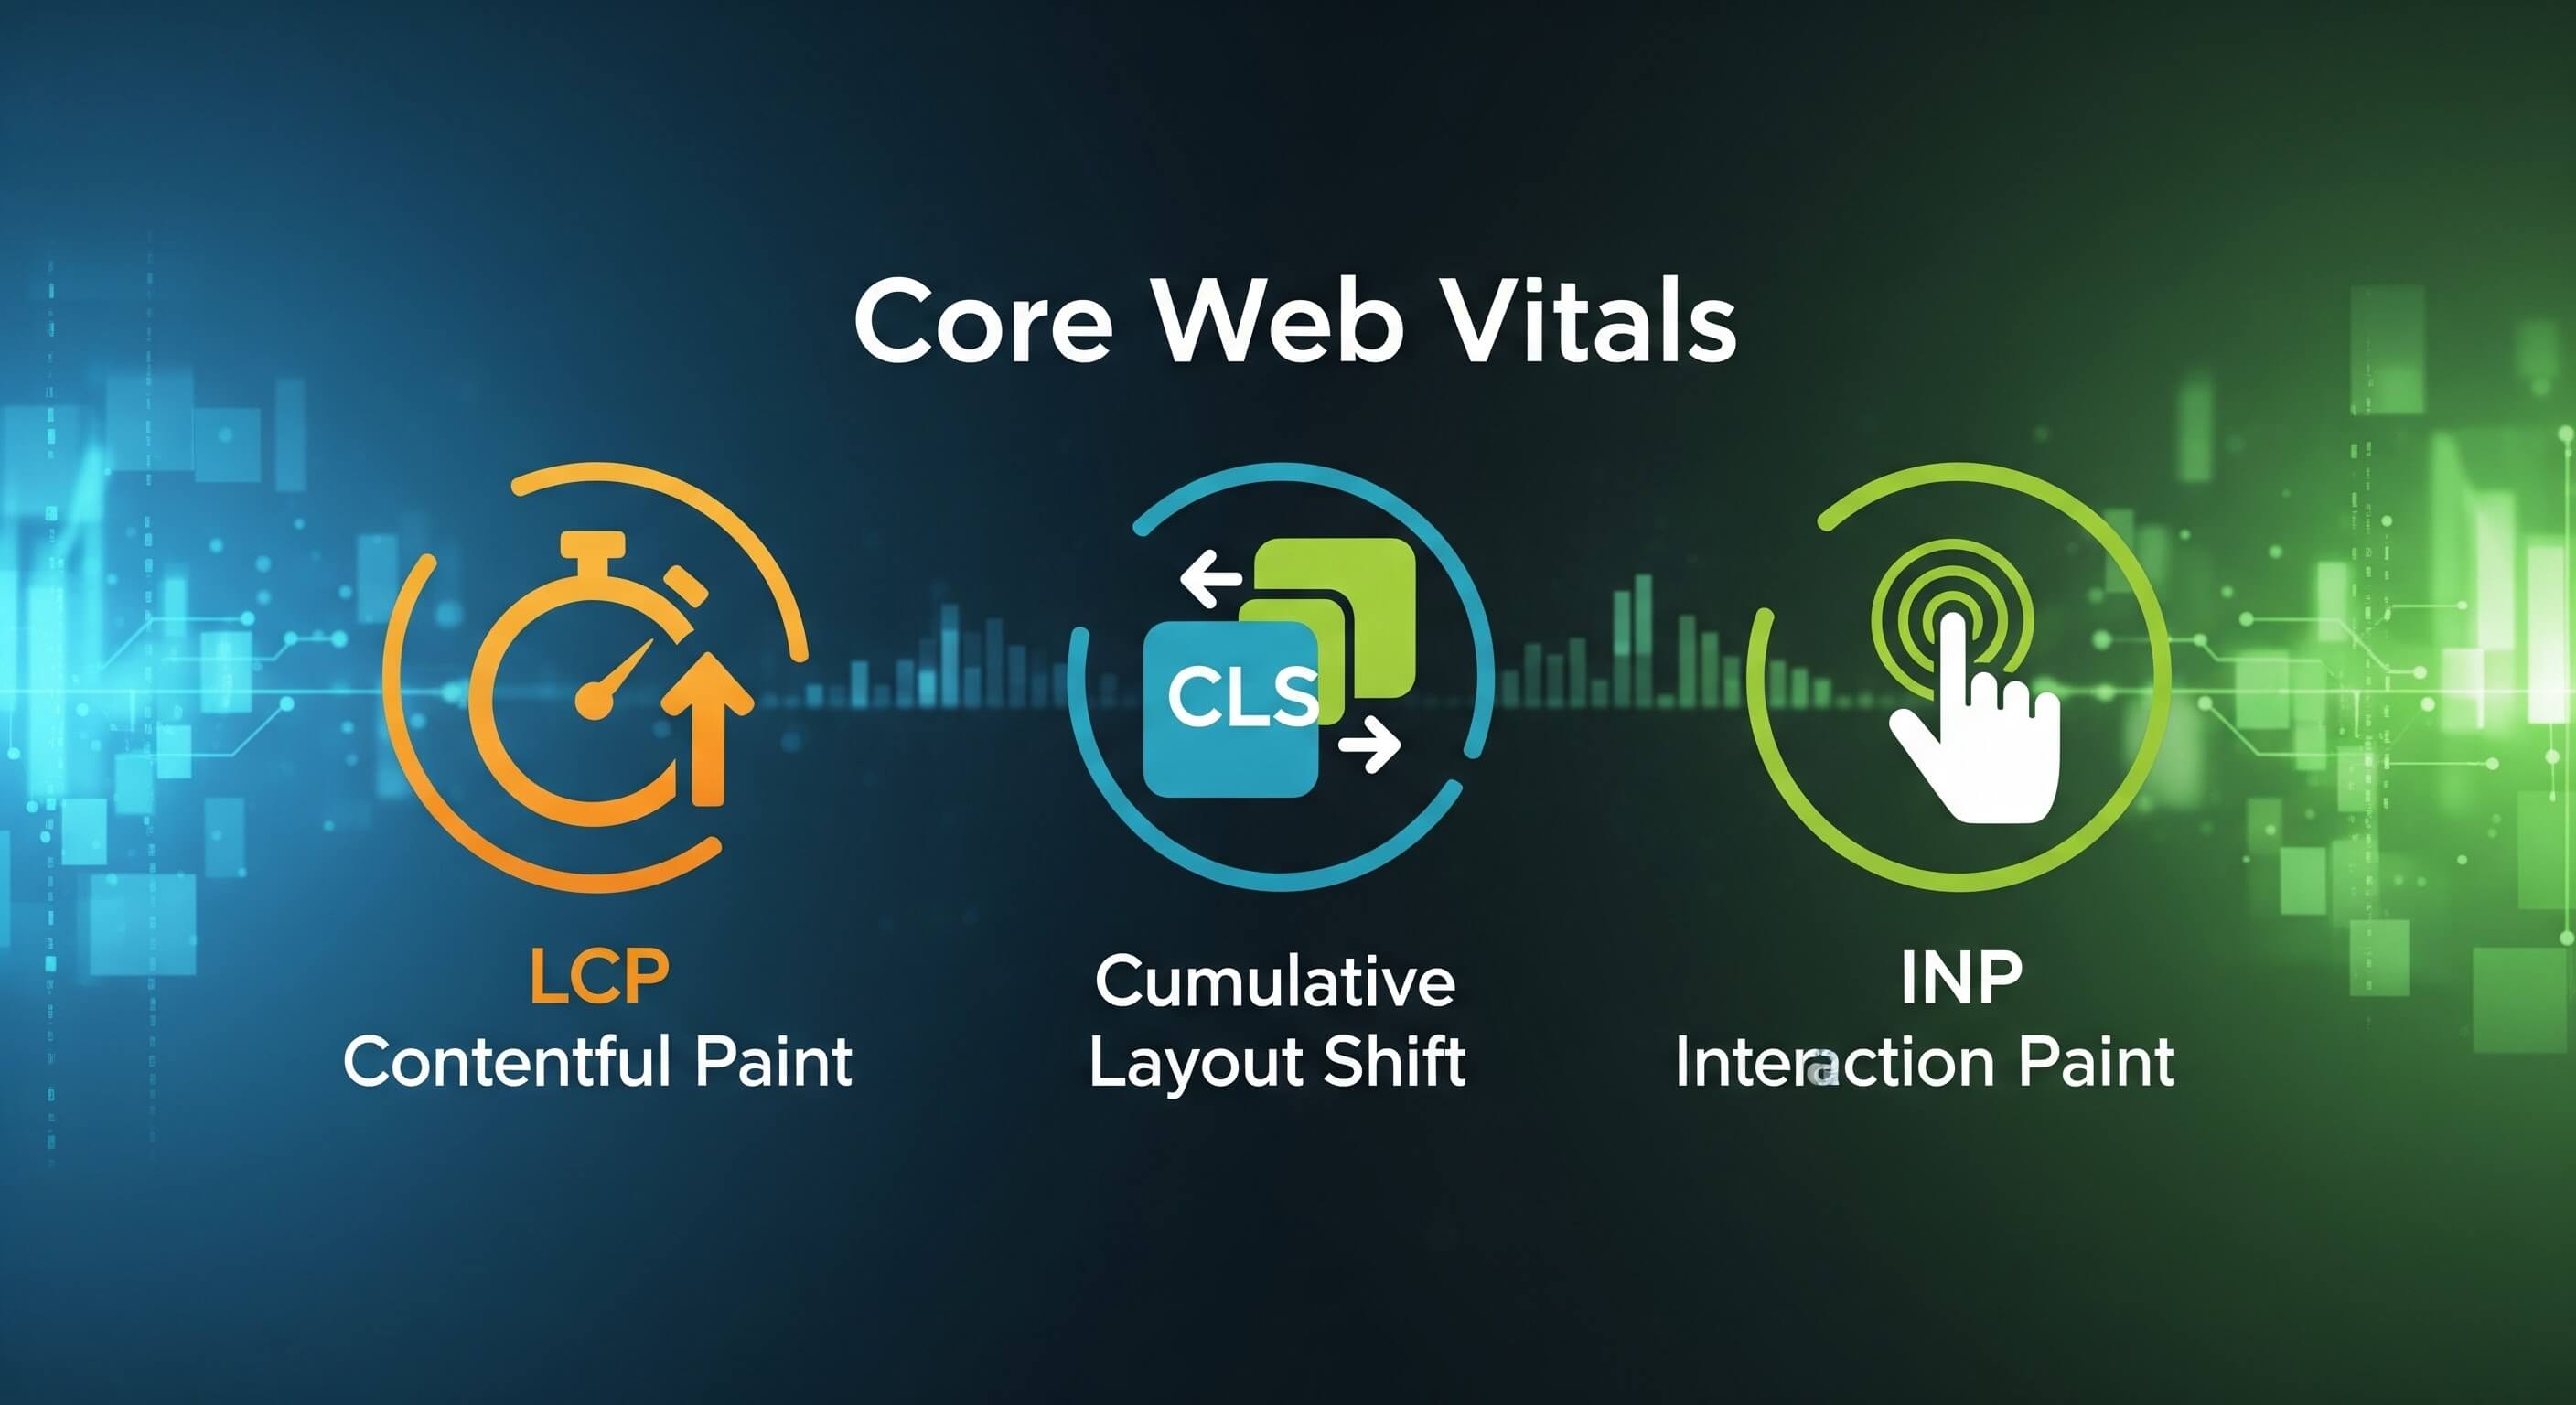
What Are Core Web Vitals? (Metrics Explained)
Core Web Vitals measure three critical aspects of real-world performance:
1. Largest Contentful Paint (LCP)
What it measures
How long it takes for the largest visible element (image, hero section, or text block) to load.
Good threshold
≤ 2.5 seconds
Why it matters
LCP represents perceived loading speed. If your main content loads slowly, users bounce.
Common LCP elements
- Hero images
- Featured banners
- H1 text blocks
- Above-the-fold media
2. Cumulative Layout Shift (CLS)
What it measures
How much the page layout shifts unexpectedly during loading.
Good threshold
≤ 0.1
Why it matters
Layout shifts cause:
- Accidental clicks
- Frustration
- Lower trust
CLS is especially problematic on:
- Ad-heavy pages
- Pages with late-loading images or fonts
3. Interaction to Next Paint (INP)
What it measures
How quickly the page responds to user interactions (clicks, taps, keyboard input).
Good threshold
≤ 200 ms
Important update
INP officially replaced First Input Delay (FID) in March 2024 because it measures overall responsiveness, not just the first interaction.
Why INP matters
Slow JavaScript execution makes pages feel laggy, even after they load visually.
Where to Find Core Web Vitals in Google Search Console
In GSC, navigate to:
Experience → Core Web Vitals
You'll see two separate reports:
- Mobile
- Desktop
URL Groups Explained
GSC groups URLs into three categories:
- Good
- Needs Improvement
- Poor
Instead of reporting per-URL data, Google clusters similar URLs with shared performance patterns. This helps you fix issues at a template or component level, not page by page.
Drill-Down View
Clicking a performance issue shows:
- Affected metric (LCP, CLS, or INP)
- Example URLs
- Affected URL count
- Trend over time
This is where prioritization happens.
How to Diagnose Core Web Vitals Issues Using GSC
Common GSC Insights & Errors
You may see messages like:
- "LCP issue: longer than 4s"
- "CLS issue: more than 0.25"
- "INP issue: longer than 500ms"
These reflect real user data collected from Chrome (CrUX), not lab tests.
Opening PageSpeed Insights from GSC
Each Core Web Vitals issue includes a direct link to PageSpeed Insights.
This is critical because:
- GSC shows what is wrong
- PageSpeed Insights shows why it's wrong
Reviewing Affected URLs & Patterns
Look for patterns such as:
- Same page template
- Same CMS component
- Same script or font
- Same ad or third-party widget
Fixing one shared issue often resolves hundreds of URLs.
How to Improve Core Web Vitals (Optimization Checklists)
Improving LCP (Largest Contentful Paint)
Key optimization tactics
- Compress and resize hero images
- Use modern image formats (WebP, AVIF)
- Preload LCP images
- Optimize server response time (TTFB)
- Remove render-blocking CSS and JavaScript
- Use proper lazy loading (not for above-the-fold elements)
- Improve hosting and CDN usage
Goal
Load the main content as fast as possible.
Fixing CLS (Cumulative Layout Shift)
Common fixes
- Always set width and height for images and videos
- Reserve space for ads and embeds
- Avoid injecting elements above existing content
- Use font-display: swap responsibly
- Prevent layout changes caused by late scripts
Goal
Keep the layout visually stable from start to finish.
Improving INP (Interaction to Next Paint)
JavaScript-focused optimizations
- Reduce long JavaScript tasks
- Break up heavy scripts
- Use code splitting
- Defer non-critical scripts
- Remove unused JavaScript
- Optimize event handlers
- Minimize third-party scripts
Goal
Ensure fast response to every interaction, not just the first click.
Tools to Support Fixing Core Web Vitals
PageSpeed Insights
- Combines lab + field data
- Directly linked from GSC
- Shows metric breakdowns and opportunities
Lighthouse
- Local testing and audits
- Great for development environments
Chrome DevTools
- Performance profiling
- JavaScript execution analysis
- Layout shift debugging
WebPageTest
- Advanced waterfall analysis
- Global test locations
- Visual performance tracking
Best Practices for Managing Core Web Vitals
Continuous Monitoring
- Check Core Web Vitals monthly
- Monitor after releases or redesigns
- Validate fixes before requesting re-indexing
Fix Templates, Not Individual URLs
- Focus on shared layouts
- Fix themes, components, and scripts
Align SEO With Development
- Include CWV checks in QA workflows
- Share GSC data with developers
- Treat performance as a product feature
Conclusion
Core Web Vitals in Google Search Console provide real user performance data that directly impacts SEO, UX, and conversions. With the retirement of the Mobile Usability Report and the introduction of INP, performance optimization has become more technical, but also more actionable.
Instead of chasing scores, focus on:
- Real-world user experience
- Sitewide improvements
- Sustainable performance practices
Core Web Vitals should be treated as a long-term technical SEO strategy, not a one-time fix.